AskCSV

About AskCSV
AskCSV is an innovative platform designed for anyone seeking to simplify data analysis with CSV files. It empowers users to ask questions about their data securely in their browser, providing valuable insights and visualizations. With its ease of use and AI-driven features, AskCSV revolutionizes data interpretation.
AskCSV offers a free service with premium features available through various pricing plans. Users can access sample datasets, and paid subscriptions provide enhanced capabilities like advanced analytics and additional data processing options, ensuring value for businesses and data enthusiasts alike.
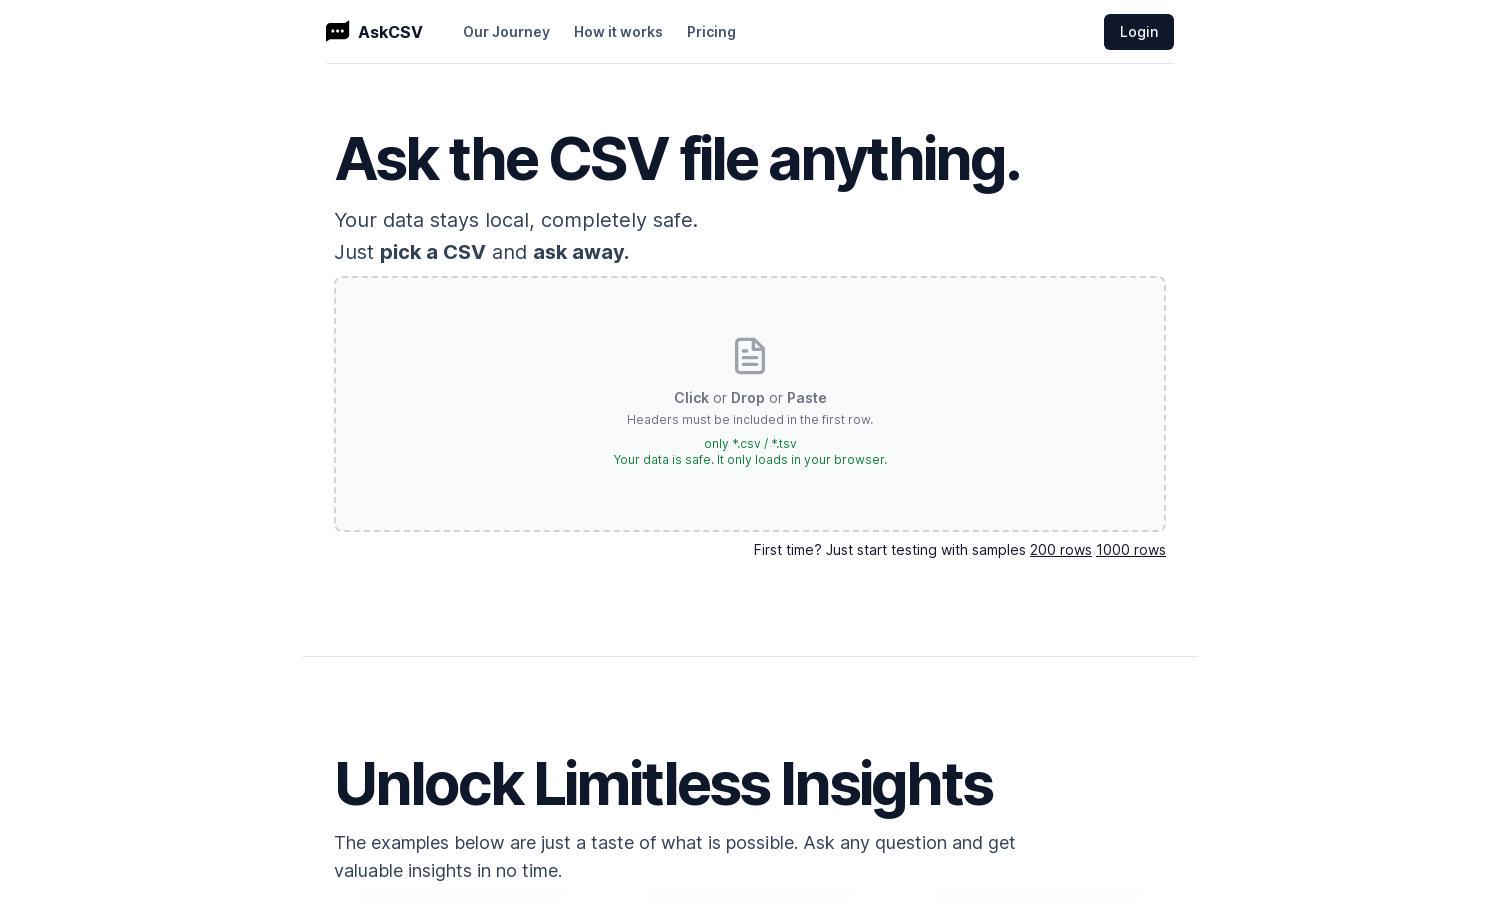
AskCSV features a clean and intuitive user interface, making it easy for users to navigate and analyze their data. The layout provides seamless access to key functionalities, like AI-driven chart recommendations and quick insights, enhancing the overall user experience as they interact with their CSV files.
How AskCSV works
Users begin by uploading a CSV file to AskCSV, ensuring their data remains private within their browser. Once uploaded, they can ask any question related to their data, and the platform's AI analyzes the information, returning insightful charts and recommendations. This straightforward process allows users to extract valuable insights with ease while maintaining full control over their data.
Key Features for AskCSV
AI-Driven Insights
AskCSV harnesses the power of AI to deliver insightful data analysis, enabling users to ask specific questions and receive meaningful visualizations. This unique feature ensures that users can quickly uncover valuable insights from their CSV files, streamlining the data analysis process effectively.
Privacy-Focused Processing
With AskCSV, users can confidently process their CSV files without fear of data breaches. The platform operates entirely within the user's browser, ensuring that sensitive data stays local and secure, making it a safe choice for data analysis.
Interactive Chart Recommendations
AskCSV provides interactive chart recommendations based on user queries, helping users visualize their data effectively. This feature enhances understanding and analysis, guiding users toward better decision-making by presenting their data in an easy-to-digest format.
You may also like:


