Parabola

About Parabola
Parabola revolutionizes data handling for businesses by automating workflows and integrating data from varied sources. Designed for teams across multiple industries, it transforms complex data processes into manageable tasks, freeing users to focus on strategic initiatives. Parabola enhances efficiency and streamlines operational workflows.
Parabola offers flexible pricing plans catering to diverse business needs, with options for individual users and larger teams. Each tier provides access to essential features, and upgrades deliver enhanced functionalities, maximizing value for users. Plans are designed to support various operational sizes and requirements efficiently.
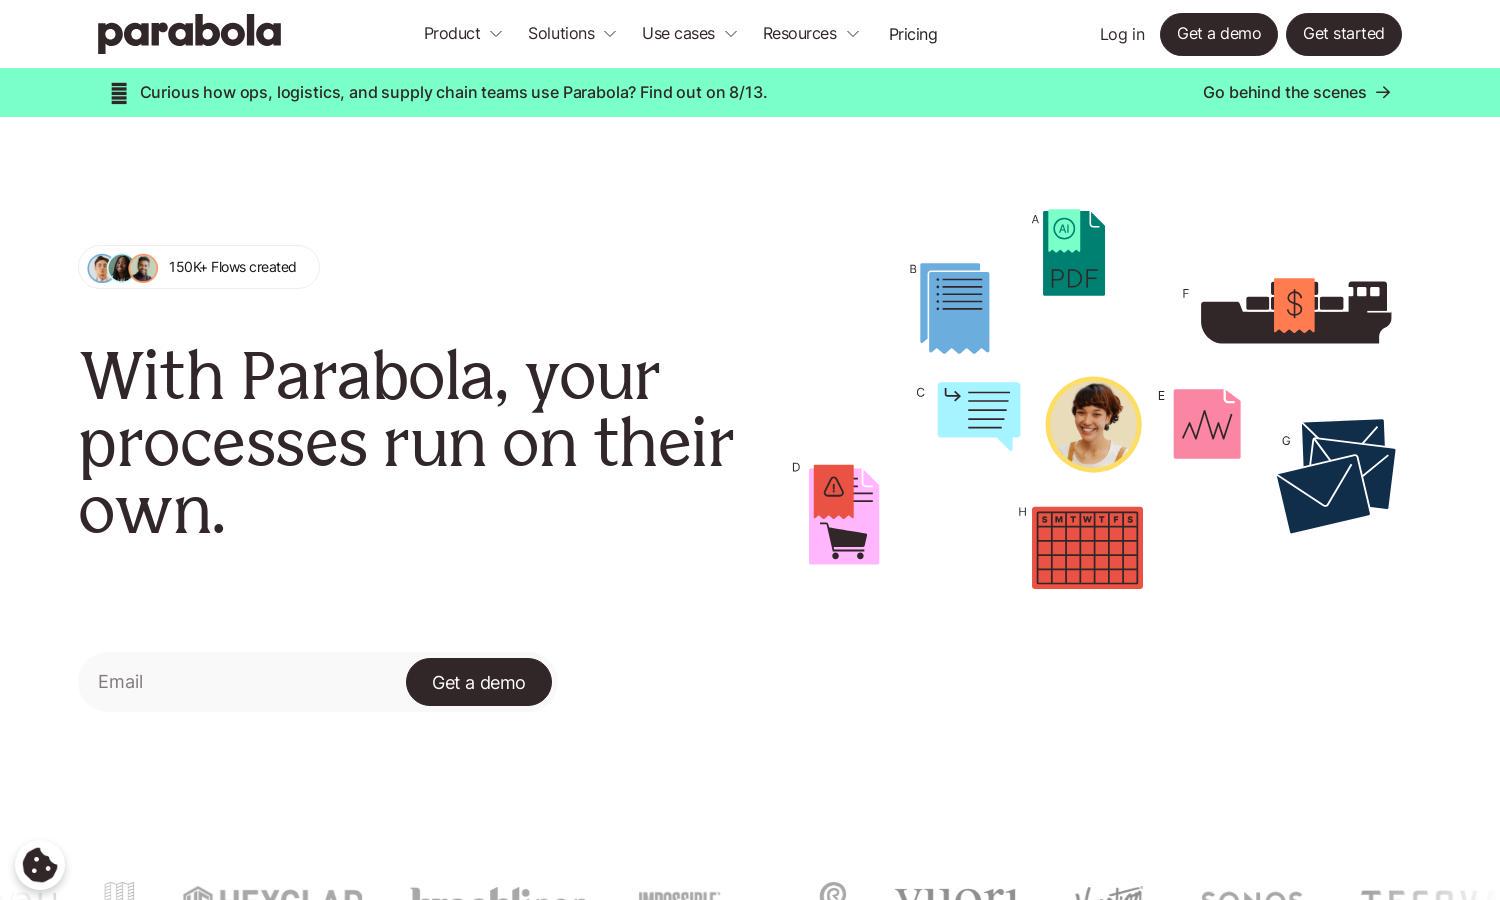
Parabola’s user interface features a clean, intuitive layout that encourages seamless interaction. Users can easily navigate between functions, enabling efficient data management and automation. The design prioritizes user experience, showcasing powerful tools and integrations that simplify complex workflows in an engaging manner.
How Parabola works
Users start their journey with Parabola by signing up and onboarding, where they familiarize themselves with the interface and features. Once onboarded, they can easily import data from sources like Excel and APIs, manipulate the data through visual workflows, and automate processes to streamline operations. Parabola's unique logic documentation and visualization tools enhance understanding and usability.
Key Features for Parabola
Automated Workflows
Parabola’s automated workflows allow users to effortlessly manage data processes by connecting diverse sources, streamlining tasks, and reducing manual effort. This core feature transforms business operations, enabling teams to focus on critical decisions rather than repetitive data management, enhancing overall productivity.
Data Integration
Parabola excels in data integration, allowing users to combine information from various platforms, including spreadsheets, APIs, and emails. This feature empowers businesses by providing a comprehensive view of their data, leading to informed decision-making and optimized operations tailored to specific needs.
Dynamic Visualizations
With Parabola's dynamic visualizations, users can create engaging charts and dashboards that simplify data representation. This key feature not only enhances understanding of complex data sets but also facilitates effective communication of insights, allowing teams to showcase important information effortlessly.


