Quills AI

About Quills AI
Quills AI revolutionizes data interaction by allowing users to engage with databases and CSVs using plain language. This innovative platform translates conversational requests into SQL queries, making data exploration intuitive. Quills AI caters to analysts and business leaders looking for efficient, tailored data insights.
Quills AI offers flexible subscription plans designed to meet client needs. Each tier provides access to essential features, including powerful data visualization tools and direct SQL interactions. Upgrading enhances insights and collaboration, making it the perfect choice for teams prioritizing data-driven decision-making.
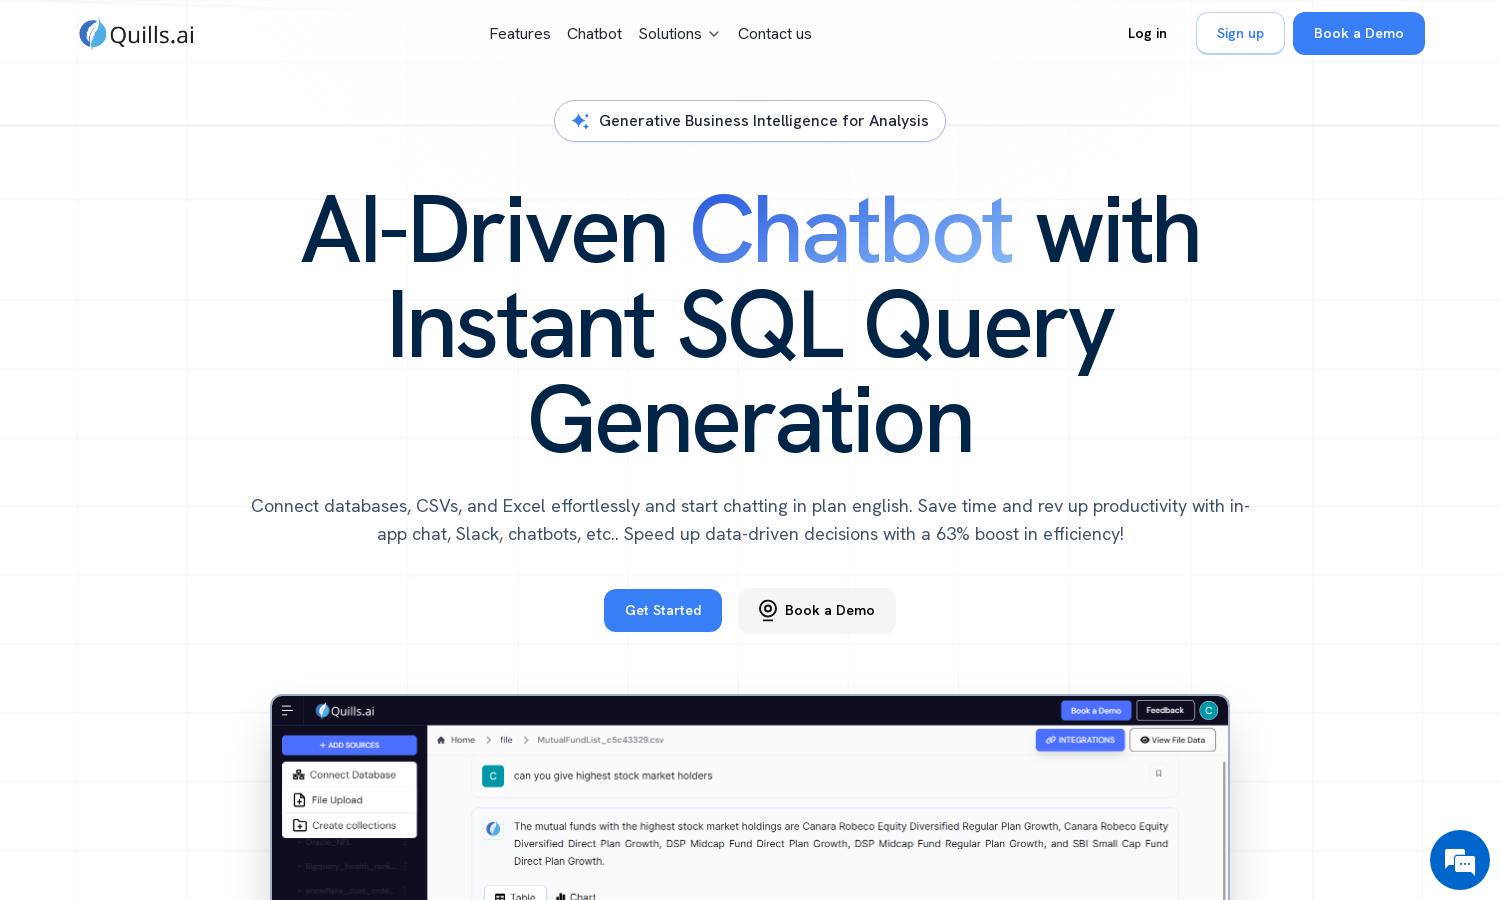
Quills AI features an intuitive user interface designed for a seamless experience. The clean layout promotes easy navigation between data sources, chat features, and visualizations. With user-friendly components and responsive design, Quills AI ensures that users effortlessly engage with their data for insightful outcomes.
How Quills AI works
Users begin their journey with Quills AI by signing up and connecting their data sources, such as databases or CSVs. After onboarding, they can interact with the platform through natural language prompts, generating SQL queries seamlessly. This intuitive system enhances data exploration, helping users unlock insights quickly and efficiently.
Key Features for Quills AI
Natural Language SQL Generation
Quills AI's natural language SQL generation feature allows users to craft complex queries without technical expertise. By simply typing requests in plain English, users benefit from streamlined data retrieval and can make data-driven decisions quickly and confidently.
Effortless Data Integration
Quills AI offers effortless data integration capabilities, allowing users to connect a variety of data sources seamlessly. This ensures comprehensive analysis and simplifies the extraction of insights, enabling teams to enhance collaboration and streamline their workflows effectively.
Interactive Data Visualization
Quills AI provides interactive data visualization tools that allow users to generate dynamic charts and graphs effortlessly. This feature enhances data understanding, enabling users to explore insights visually, share findings, and make informed decisions based on user-friendly visual representations.
You may also like:


