Simple Analytics

About Simple Analytics
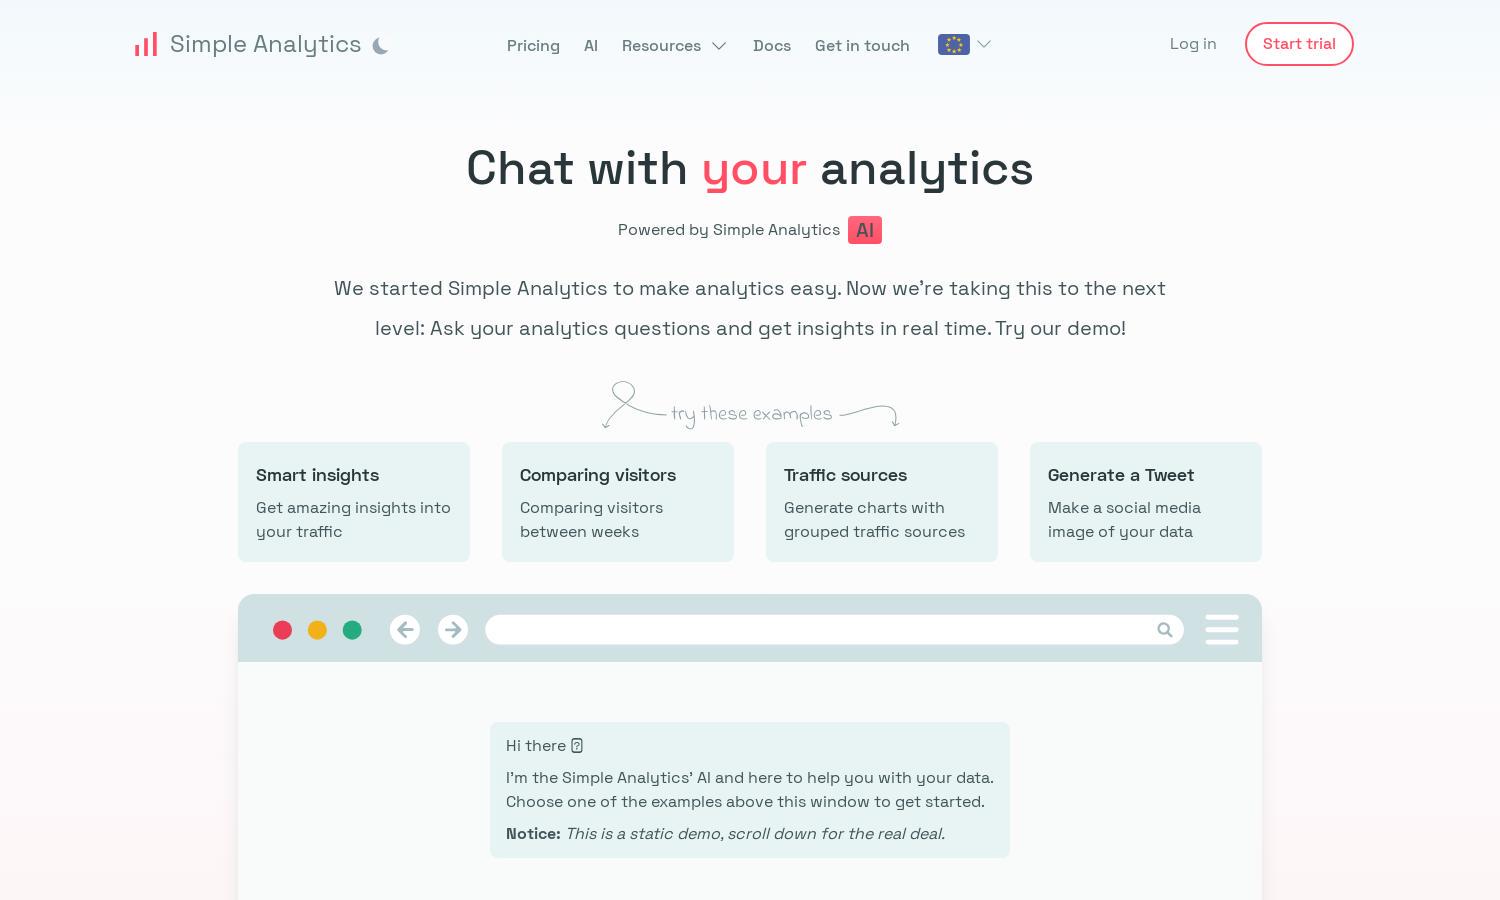
Simple Analytics engages users by allowing them to chat directly with their analytics data for real-time insights. Its unique AI feature offers smart, easy-to-understand analytics and chart generation, helping users effortlessly interpret traffic data and make informed decisions that drive growth.
Simple Analytics offers a free 14-day trial with no credit card required, providing users an opportunity to explore the platform's capabilities. After the trial, subscription options are available with flexible pricing, allowing users to choose a plan that best suits their data needs.
Simple Analytics boasts a clean, intuitive user interface designed for seamless interaction with analytics data. Its straightforward layout enhances user experience, ensuring that data visualization and insight generation are just a few clicks away, making analytics accessible to everyone.
How Simple Analytics works
Users begin their experience with Simple Analytics by signing up for a free trial, after which they can easily navigate through the platform. By asking questions about their analytics data, users receive instant insights and beautifully generated charts. The intuitive dashboard simplifies interaction, making data comprehension effortless and engaging for users.
Key Features for Simple Analytics
Real-time Insights
Simple Analytics delivers real-time insights through an interactive chat interface, enabling users to ask questions and receive immediate answers about their analytics data. This unique feature empowers users to understand traffic patterns and make informed decisions swiftly, enhancing overall data-driven strategies.
Traffic Source Comparison
With Simple Analytics, users can compare traffic sources effectively using grouped data visualization tools. This essential feature helps identify the most effective channels for attracting visitors, allowing users to adjust their marketing strategies and optimize their digital presence for better results.
Chart Generation
Chart generation is a standout feature of Simple Analytics, enabling users to create beautiful visual representations of their data effortlessly. This functionality aids users in presenting insights clearly, making it easier to communicate performance metrics and trends to stakeholders or team members.


