Zelma

About Zelma
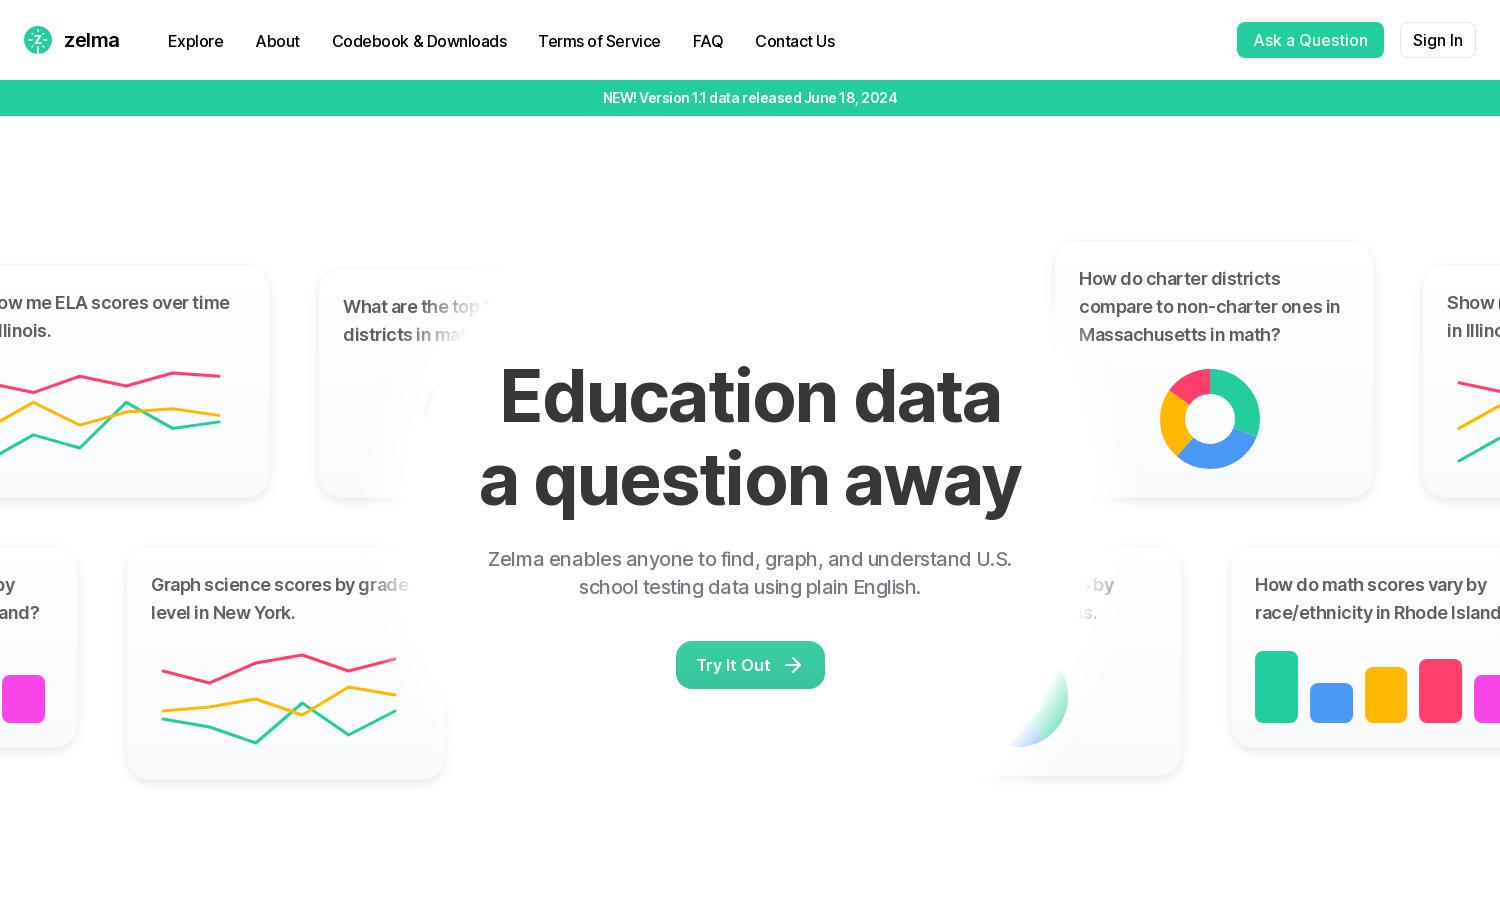
Zelma is an innovative AI-driven platform designed for educators, researchers, and policy makers seeking comprehensive U.S. school testing data. Users can effortlessly query and visualize data using simple English, making complex educational insights accessible. This unique capability allows for informed decision-making and improved educational strategies.
Zelma's pricing plans offer tiered subscriptions catering to various user needs. The basic plan provides access to essential features, while premium tiers unlock advanced analytics and customized reports. Users gain significant insights, enhancing their research capabilities while enjoying affordability and scalable benefits that expand as their data needs grow.
Zelma's user interface is designed for seamless navigation and accessibility. Its intuitive layout ensures that users can easily explore educational data, access comprehensive reports, and utilize advanced visualization tools. Unique features enhance user experience, making data exploration not only manageable but enjoyable, reflecting Zelma's commitment to user-centric design.
How Zelma works
Users interact with Zelma by first creating an account for a personalized experience. Upon onboarding, they can input queries in plain English regarding student test data, such as comparisons by demographics or grade. Zelma swiftly processes these inquiries, delivering clear visual representations and insightful reports, making data analysis straightforward and efficient.
Key Features for Zelma
AI-Powered Data Exploration
Zelma features an AI-powered data exploration tool allowing users to query vast educational datasets using simple language. By transforming complex data into understandable visuals and insights, it empowers educators and researchers to make informed decisions based on accurate, real-time information.
Customizable Reporting Tools
Zelma’s customizable reporting tools let users generate tailored reports, focusing on specific metrics or comparisons that matter most to them. This unique feature enhances the analytical experience, allowing personalized insights that cater to different educational contexts and decision-making processes.
Visual Data Insights
The visual data insights feature of Zelma transforms raw educational data into engaging graphs and tables. This visual representation not only simplifies the data analysis process but also helps users quickly grasp trends and discrepancies within testing performance across various demographics and school districts.
You may also like:


