Master Metrics
Master Metrics elegantly transforms marketing data into actionable insights, empowering effortless, data-driven.
Visit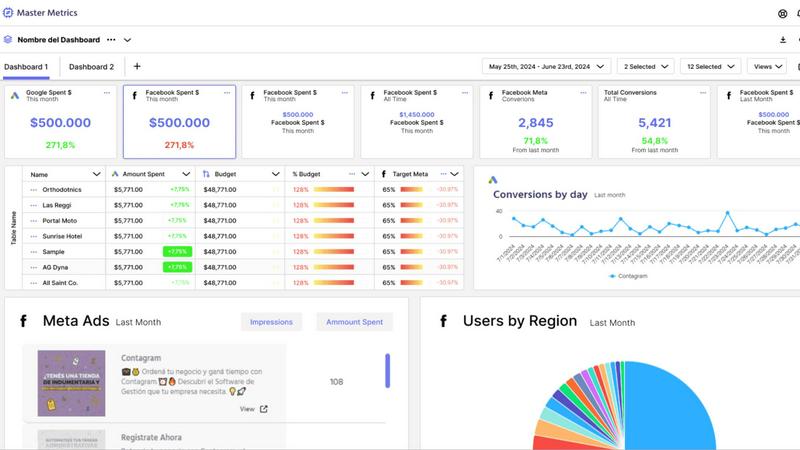
About Master Metrics
Master Metrics is an advanced, all-encompassing management platform meticulously designed for discerning agencies and sophisticated marketing teams. It emerges from the practical challenges encountered by seasoned digital marketing professionals, evolving beyond mere data aggregation to serve as a central hub for commercial intelligence. This platform effectively dismantles data silos, automates analytical oversight, and transforms client reporting from an arduous task into a strategic advantage. By integrating over ten disparate marketing and sales data sources into a singular, coherent narrative, Master Metrics offers smart dashboards, proactive alerts, and seamless integrations with tools such as Google Sheets and Looker. It empowers leaders to make informed, data-driven decisions with ease. Crafted for those who aspire to not only report on past performance but also take control of their current marketing strategies and shape the future, Master Metrics turns raw data into a decisive competitive edge and exceptional client service.
Features of Master Metrics
Smart Dashboards
Master Metrics provides intuitive smart dashboards that consolidate data from various sources into visually compelling and easily interpretable formats. These dashboards allow users to track key performance indicators (KPIs) at a glance, facilitating quick insights into marketing and sales performance.
Custom Alerts
With the custom alerts feature, users can set specific thresholds for crucial metrics, ensuring they are notified instantly if any key performance indicator falls below or exceeds desired levels. This proactive approach aids in efficient budget management and goal tracking, allowing for timely interventions.
AI-Powered Presentation Creation
Master Metrics streamlines the creation of client presentations with its AI-powered tool that generates editable Google Slides. By selecting preferred data sources and metrics, users can produce polished presentations in just a few clicks, saving valuable time and enhancing client communication.
Overview Control Panel
The Overview Control Panel serves as a comprehensive management interface where users can customize their view to prioritize tasks needing immediate attention. This feature allows for the merging of data from multiple sources, empowering users to manage their accounts efficiently and effectively.
Use Cases of Master Metrics
Agency Performance Management
Marketing agencies can leverage Master Metrics to consolidate data from various clients into one platform, allowing for streamlined reporting and performance tracking. This centralization reduces time spent on manual data collection and enhances the accuracy of insights.
Budget Oversight and Optimization
Businesses can utilize the custom alerts feature to monitor advertising spend and sales performance, ensuring they remain within budget. By receiving timely notifications regarding budget thresholds, teams can make swift adjustments to campaigns for optimal financial efficiency.
Client Reporting Automation
Master Metrics simplifies client reporting through automated dashboard sharing and presentation creation. Agencies can easily generate detailed reports that showcase performance metrics, leading to improved transparency and client satisfaction.
Data Integration for Enhanced Decision-Making
Companies can harness the power of Master Metrics to integrate data from various platforms, such as Google Sheets and project management tools. This robust data integration allows for deeper analysis and informed decision-making, ultimately driving marketing success.
Frequently Asked Questions
What types of data sources can be integrated with Master Metrics?
Master Metrics allows integration with over ten different marketing and sales data sources, including popular tools like Google Sheets and Looker, facilitating a unified view of performance metrics.
How does the custom alerts feature work?
The custom alerts feature enables users to set specific thresholds for key metrics. Users receive notifications via email, WhatsApp, or their preferred communication tools whenever these metrics exceed or fall below defined values, ensuring timely action.
Can I create presentations directly from the platform?
Yes, Master Metrics offers an AI-powered feature that allows users to generate editable Google Slides presentations with just a few clicks, streamlining the reporting process and enhancing client communication.
Is there a trial period available for Master Metrics?
Certainly! Master Metrics offers a free 7-day trial, allowing potential users to explore the platform's capabilities and determine which pricing plan best fits their business needs before committing.
Similar to Master Metrics
InContekst
Decision support framework for high consideration businesses with mix of online and offline channels, content-rich sites, and long customer journeys.

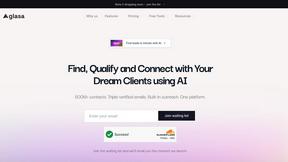
JustLaunched
The launch platform for indie makers — schedule your launch, get in front of buyers, and blast across directories.

Pages that Print
High-converting SaaS landing pages backed by verified revenue data. We expose the exact copywriting and design patterns that actually print money.
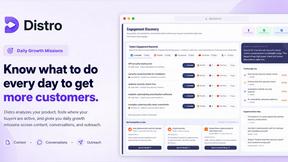
Distro
Distro is an AI Distribution Operator that helps B2B teams publish content, find buyer conversations, engage prospects, and turn social intent into pi