fnel vs Fusedash
Side-by-side comparison to help you choose the right product.

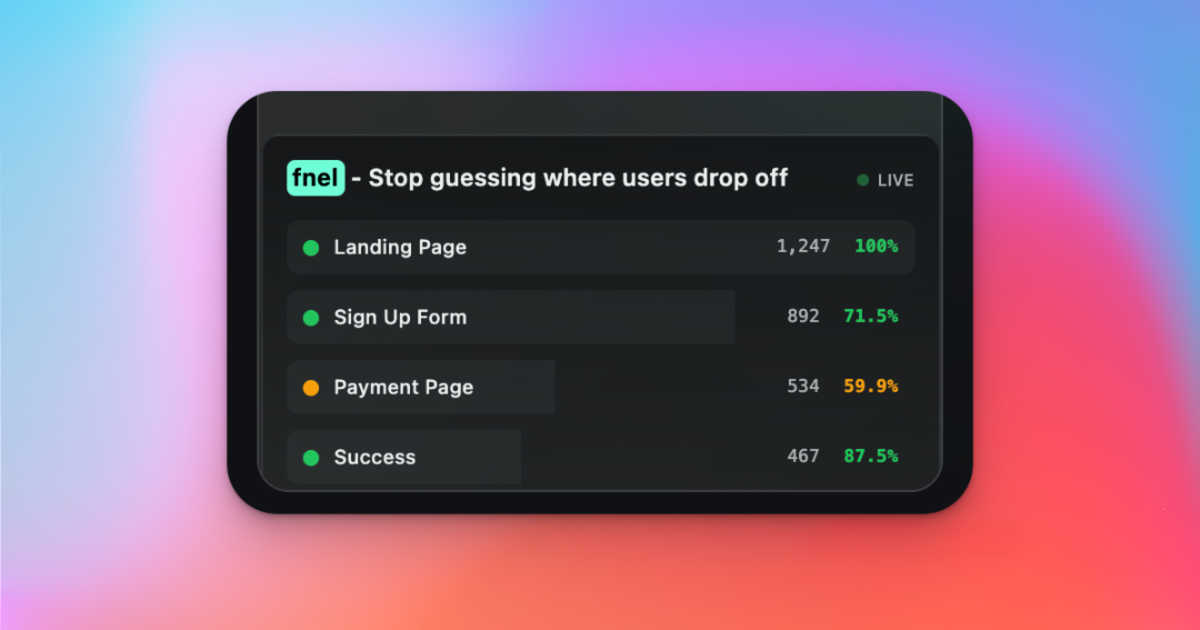
Fnel provides solo founders with real-time funnel analytics to instantly identify and fix conversion leaks.
Last updated: March 1, 2026
Fusedash transforms raw data into elegant, actionable dashboards and charts for instant team insights.
Last updated: March 4, 2026
Visual Comparison
fnel
Fusedash

Feature Comparison
fnel
Real-Time Funnel Visualization
fnel provides instantaneous, visual mappings of your critical user journeys, from initial landing to final conversion. Unlike static reports, these dynamic funnels update in real-time, offering a live pulse on user behavior. You can immediately see the volume of users at each step and the exact percentage that advances or drops off, transforming abstract data into an intuitive, actionable story of your funnel's health and performance without any manual data synthesis.
One-Line Code Integration
Designed with the developer's precious time in mind, fnel eliminates weeks of complex setup. Integration is achieved through a singular, elegant code snippet. Once initialized with your unique API key, you can immediately begin tracking events that correspond to each step in your user flow. This frictionless adoption means you can transition from installation to insight in mere minutes, not days, accelerating your path to optimization.
Smart Drop-Off Detection & Alerts
fnel proactively monitors your funnel performance, employing intelligent algorithms to automatically detect anomalous drop-off rates at specific steps. When a step suddenly underperforms—such as a 40% exit on a payment page—the system triggers an alert. This critical feature ensures you are notified of conversion leaks the moment they occur, enabling you to investigate and remediate issues like broken forms or confusing UX before they impact revenue.
A/B Test Validation at the Funnel Level
Move beyond superficial click metrics. fnel allows for rigorous A/B testing validation by measuring the impact of different variants on step-by-step conversion rates within your funnel. You can ascertain with statistical confidence whether a new pricing page design or CTA button color genuinely improves progression to the next critical stage, providing a definitive, funnel-centric view of what truly optimizes your user journey.
Fusedash
Unified AI Visualization Workspace
Fusedash consolidates the entire data visualization lifecycle into one elegant environment. Move fluidly between creating interactive dashboards for real-time KPI monitoring, generating standalone AI-powered charts, crafting detailed geographic maps, and authoring contextual narrative reports. This eliminates the need to rebuild logic across disconnected tools, ensuring every visual and insight originates from the same consistent dataset and metric definitions, saving invaluable time and eradicating reporting discrepancies.
AI Chart Generator
Accelerate insight discovery with an intelligent chart generator that transforms your CSVs or API data into clear, compelling visuals in minutes. This feature intelligently suggests optimal chart types, applies meaningful comparisons, and helps refine labels to ensure each visual accurately tells your data's story. Generated charts can serve as powerful standalone assets or be seamlessly integrated into broader dashboards and reports, providing a fast track from raw data to understood insight.
Contextual Storytelling & Reporting
Bridge the gap between data presentation and strategic understanding with integrated storytelling. Fusedash allows you to combine performance dashboards with narrative context, explaining what changed, why it matters, and what the next steps should be. This transforms static reports into dynamic, communicative documents that provide stakeholders with not just the numbers, but the crucial context needed for alignment and confident decision-making.
Smart Data Chat & Exploration
Navigate your data with conversational ease using Fusedash's integrated AI chat. Pose questions in plain language to explore breakdowns, uncover trends, and receive intelligent suggestions for relevant metrics or visualizations. This natural interface democratizes data exploration, allowing users of all technical skill levels to interrogate information and instantly transform their discoveries into shareable, persistent dashboard views.
Use Cases
fnel
SaaS Product Signup Flow Optimization
For SaaS founders, the journey from visitor to activated user is paramount. fnel enables precise tracking of this sequence: landing page view, signup form submission, email verification, onboarding start, and final activation. By visualizing where potential customers abandon the process, founders can identify and fix specific friction points—such as a cumbersome verification step or a confusing onboarding tutorial—thereby systematically improving activation rates and reducing customer acquisition cost.
E-commerce Checkout Conversion Analysis
E-commerce businesses live and die by their checkout completion rate. fnel is expertly applied to visualize the critical path from cart addition, through shipping information entry, to payment submission and final order confirmation. This clear visualization pinpoints exactly where shoppers hesitate or abandon their carts, allowing merchants to streamline forms, clarify costs, or address payment gateway issues to recover lost sales and boost revenue.
Agency Lead Generation Funnel Tracking
Marketing agencies and consultants can leverage fnel to demonstrate tangible ROI from campaigns. By tracking a lead funnel from initial form submission, through qualification steps, to the ultimate booking of a discovery call, fnel provides irrefutable data on which channels and campaigns deliver not just clicks, but qualified, progressing leads. This empowers agencies to optimize ad spend and prove their value to clients with step-level conversion evidence.
Side Project & MVP Validation
Indie hackers and builders launching minimum viable products (MVPs) need rapid, clear feedback on user engagement. fnel's simplicity is perfect for this stage, allowing creators to instantly instrument their prototype and see if users are progressing through the intended core flow. This immediate insight is invaluable for validating product-market fit, identifying critical usability flaws early, and iterating based on actual user behavior rather than assumption.
Fusedash
Executive Leadership & Board Reporting
Provide leadership with a consistent, high-level view of organizational health. Fusedash enables the creation of executive dashboards that aggregate key financial, operational, and customer metrics, complemented by narrative storytelling that highlights achievements, explains variances, and outlines strategic forecasts, ensuring all decision-makers are informed by a single, reliable source of truth.
Marketing Performance & Campaign Analysis
Empower marketing teams to move beyond spreadsheets. Connect advertising platform APIs, CRM data, and web analytics to build dynamic dashboards that track campaign ROI, channel performance, and lead generation in real-time. Use segmentation and drill-downs to understand audience behavior and optimize spend, while sharing clear, visual reports with stakeholders to demonstrate impact.
Operational Monitoring & Geographic Insight
Monitor real-time operational metrics across locations or regions. By integrating map-based visualizations, teams in logistics, retail, or field services can instantly see performance geographically, identify hotspots or underperforming areas, and drill down to understand local drivers. This provides an intuitive, at-a-glance understanding of distributed operations.
Cross-Departmental KPI Alignment
Eliminate departmental silos and conflicting data stories. Fusedash allows organizations to define core company KPIs once and then deploy them across customized dashboards for sales, finance, support, and product teams. This ensures every department is measuring success with the same definitions, fostering alignment and collaborative problem-solving based on unified data.
Overview
About fnel
In the demanding arena of early-stage ventures, where clarity is as valuable as capital, fnel emerges as an indispensable analytical companion. It is a sophisticated funnel analytics platform, meticulously engineered for the discerning solo founder, indie hacker, and startup pioneer. fnel elegantly discards the cumbersome paradigms of traditional analytics—the labyrinthine integrations, the overwhelming dashboards brimming with irrelevant data—to deliver a singular, profound insight: the precise moment and location where user engagement dissipates. With an ethos of elegant simplicity, fnel requires but a single line of code to unlock real-time, visual funnel intelligence, transforming opaque user behavior into a lucid narrative of progression and attrition. This empowers creators to make swift, informed decisions to optimize signup flows, refine onboarding sequences, and bolster conversion strategies. Whether validating a nascent concept, nurturing a side project, or scaling an initial SaaS offering, fnel provides the crystalline clarity and actionable intelligence necessary for decisive growth. It is the epitome of developer-friendly, lightweight design, allowing visionaries to dedicate their energy to building remarkable products, not configuring complex analytical tools.
About Fusedash
Fusedash is the definitive AI-powered data visualization platform engineered for modern teams who demand clarity, consistency, and decisive action from their data. It transcends the limitations of fragmented analytics tools by providing a singular, intelligent workspace where raw data from disparate sources is transformed into a coherent, decision-ready narrative. Designed for organizations weary of manual reporting cycles and conflicting data interpretations, Fusedash establishes a single source of truth. Its core genius lies in operationalizing consistency: key metrics and KPIs are defined once and then seamlessly reused across every dashboard, interactive chart, detailed map, and narrative report. This ensures that leadership, marketing, operations, and beyond are all aligned, viewing and acting upon the same trusted numbers. Beyond mere monitoring, Fusedash empowers deep understanding with intuitive drill-down capabilities and integrated AI features like natural language data chat. It is more than a dashboard tool; it is a comprehensive platform for data storytelling, real-time monitoring, and collaborative insight, turning complex information into a strategic asset that drives organizational alignment and informed action.
Frequently Asked Questions
fnel FAQ
How is fnel different from Google Analytics or Mixpanel?
fnel is purpose-built with a singular, focused objective: to provide immediate, actionable funnel intelligence with minimal setup. Unlike the broad, often overwhelming scope of GA or the complex event schema requirements of Mixpanel, fnel offers a streamlined experience. It delivers step-level conversion insights and automated drop-off detection out-of-the-box, eliminating noise and configuration complexity to show you precisely where users leave and what to fix next.
Is there a free plan available to start with?
Absolutely. fnel offers a Free Starter plan designed for initial validation and early-stage projects. This plan includes up to 5,000 events per month and allows tracking for up to 3 distinct funnels, complete with access to the real-time dashboard and basic drop-off analysis. You can begin using it immediately without requiring a credit card, upgrading seamlessly when your needs expand.
What are the details of the Pro and Lifetime plans?
The Pro plan, priced at $12 monthly (or $9.99 per month when billed annually), is tailored for serious growth. It includes up to 100,000 monthly events, unlimited funnel tracking, advanced drop-off analysis, data export capabilities (CSV/JSON), and priority support. The Lifetime Access plan is a one-time payment that grants all Pro features permanently, including lifetime updates and premium support, with no recurring monthly fees.
How long does setup and integration typically take?
Setup is engineered for remarkable speed. The process involves installing the fnel package, adding your API key to your configuration, and beginning to track key events in your application's code. For a standard funnel, this can be completed and yielding live data in under five minutes. The platform requires zero complex configuration, allowing you to gain insights almost immediately after integration.
Fusedash FAQ
What types of data sources can I connect to Fusedash?
Fusedash offers flexible data integration capabilities to suit various workflows. You can start by uploading CSV files directly into the platform for quick analysis. For live, updated data, you can connect to a wide range of sources via API connections. The platform is designed to allow you to combine these datasets into a single, coherent view for comprehensive reporting and analysis.
How does Fusedash ensure data consistency across reports?
Consistency is a foundational principle of Fusedash. The platform allows you to centrally define your key metrics, dimensions, and calculation logic. Once these "single sources of truth" are established, you can reuse them across every dashboard, chart, map, and report you create. This means that whether the CEO or a marketing manager is viewing the data, they are guaranteed to be looking at numbers calculated the same way, eliminating conflicts and building trust.
Can I use Fusedash for real-time data monitoring?
Absolutely. Fusedash is built for both reflective analysis and proactive monitoring. By connecting to live data sources via APIs, you can create real-time interfaces and dashboards that update automatically. This allows teams to monitor critical KPIs, track live campaign performance, or oversee operational metrics as they happen, enabling swift identification and response to trends or issues.
Is technical expertise required to use the AI Chat and Chart Generator?
Not at all. A core design goal of Fusedash is to make advanced data exploration accessible. The AI Chart Generator guides you through visualization choices based on your data. The Smart Data Chat feature is designed for natural language interaction—you can ask questions like "What were sales by region last quarter?" or "Show me a trend of website traffic," and the AI will help find the answers and suggest appropriate visuals, requiring no code or complex query writing.
Alternatives
fnel Alternatives
Fnel is a specialized funnel analytics platform designed to provide solo founders and early-stage startups with immediate clarity on user conversion paths. It belongs to the analytics and data category, distinguished by its developer-friendly, single-line setup and real-time visualizations that cut through the noise of more complex systems. Users may explore alternatives for various reasons, including evolving budgetary considerations, the need for broader feature sets as their venture grows, or specific platform integrations that align with a more mature tech stack. The search often stems from a desire for either greater simplicity or more comprehensive, enterprise-grade capabilities. When evaluating other solutions, discerning founders should prioritize intuitive design, actionable insight generation, and seamless implementation. The ideal tool should align with both current operational bandwidth and future strategic ambitions, ensuring analytics empower growth rather than complicate it.
Fusedash Alternatives
Fusedash is an AI-powered data visualization and business intelligence platform designed to transform raw data into a unified source of truth. It enables teams to create consistent, decision-ready dashboards and reports, ensuring organizational alignment and action from a single workspace. Users may explore alternatives for various reasons, including specific budgetary constraints, the need for specialized features beyond core visualization, or integration requirements with a particular technical stack. The search often stems from a desire to find a solution that aligns perfectly with a team's unique scale, workflow, and data maturity. When evaluating options, it is essential to consider not only the breadth of visualizations but also the underlying architecture for data consistency. Key differentiators often lie in the efficiency of maintaining metric definitions, the depth of real-time analysis, and the sophistication of tools that democratize data access across all team members, from analysts to executives.