
Chart Echo
Chart Echo reveals how similar chart patterns played out historically, giving you real precedent before you trade.
Visit
About Chart Echo
Chart Echo is an elegant analytical instrument designed for traders and investors who seek clarity from the market's own history. At its core, the product performs a singular, powerful function: it takes the exact shape of the chart you are currently observing and searches across roughly 450 million historical windows in stocks and cryptocurrency to find moments that looked remarkably similar. This is not a predictive tool nor a source of financial advice; it is a sophisticated memory engine for the markets. By identifying these fractal echoes, the platform overlays past matches directly onto your current setup in gold, allowing you to see how similar patterns resolved in the days and weeks that followed. The value proposition is refreshingly direct: replace subjective guesswork and noisy indicators with a data-grounded picture of precedent. You receive honest statistics on how often similar setups rose, fell, or stagnated, along with average moves and typical drawdowns. Chart Echo is built for active traders wanting to validate setups, long-term investors seeking to sanity-check breakouts against decades of history, and crypto watchers who understand that digital assets rhyme intensely with their own past structures. The experience is guided, seamless, and free to start with no account required, making sophisticated pattern matching accessible to anyone who values precedent over opinion.
Features of Chart Echo
Historical Pattern Matching Engine
The heart of Chart Echo is its ability to analyze the precise geometric shape of your current chart and cross-reference it against an immense database of nearly 450 million historical windows. This is not a simple correlation check; it is a sophisticated fractal matching process that identifies structural similarities in price action across different timeframes and assets. When a match is found, the platform provides a ranked list of echoes, each accompanied by a similarity score and a clear explanation of why the patterns rhyme. This allows you to instantly see which historical moments share the most DNA with your current setup, transforming decades of market data into a single, actionable reference point.
Interactive Echo Overlay
Once a historical match is identified, Chart Echo does not merely show you a list of dates. It overlays the past pattern directly onto your current chart in a distinctive gold color, creating a visual comparison that is both intuitive and powerful. You can see exactly how the historical price action aligned with your setup and, crucially, how it continued after the match point. This feature allows you to study the subsequent trajectory of similar patterns, understanding the typical path, the volatility, and the eventual outcome. It transforms abstract statistical data into a concrete visual narrative, making it far easier to internalize the lessons of precedent.
Outcome Statistics and Aggregated Data
Beyond individual matches, Chart Echo aggregates the continuations of all high-confidence historical echoes to provide a clear, honest statistical picture. You are presented with aggregated data showing the probability of various outcomes: how often setups like yours rose, fell, or moved sideways. You can see the average expected move, the typical maximum drawdown, and the range of potential results over specific time horizons. This feature moves the analysis from anecdotal vibes to empirical evidence, giving you a realistic understanding of the odds before you commit capital. It is a powerful sanity check that grounds your decision-making in the market's own recorded behavior.
Workspace Saving and Fractal Alerts
For users who create an account, Chart Echo offers the ability to save entire workspaces, preserving your current chart, the matches found, and the overlaid echoes for future review. This is invaluable for tracking evolving setups over time. Furthermore, premium users can set reminders and receive notifications when their favorite chart prints a strong fractal projection. This proactive feature ensures you never miss a significant pattern match, allowing you to monitor multiple assets and timeframes effortlessly. The platform also facilitates sharing through the generation of Story GIFs and images, enabling you to discuss your findings with a community of fellow traders or friends.
Use Cases of Chart Echo
Validating Active Trading Setups
For the active day trader or swing trader, the primary use case is validating a potential trade before entering. Before committing to a breakout or a breakdown, you can run the current chart through Chart Echo to see how similar patterns have historically performed. You can quickly assess the probability of follow-through, the typical drawdown during the trade, and the average holding period for success. This transforms a gut feeling into a data-backed assessment, allowing you to filter out low-probability setups and focus only on those with strong historical precedent.
Sanity-Checking Long-Term Investment Decisions
Long-term investors often face moments of uncertainty during significant market moves, such as a major sell-off or a powerful breakout. Instead of relying on a single pundit's opinion or a headline, Chart Echo allows you to sanity-check these events against decades of historical precedent. You can see how similar structural breakdowns or breakouts have resolved over the following months or years. This provides a calm, data-driven perspective that helps you avoid emotional decisions, whether that means holding through a correction that has historically been a buying opportunity or taking profits during a blow-off top that has often led to a significant decline.
Analyzing Crypto Market Rhythms
Cryptocurrency markets are known for their intense volatility and tendency to repeat certain structural patterns, often referred to as "rhyming." Chart Echo is particularly powerful for crypto watchers analyzing Bitcoin, Ethereum, and other major altcoins. You can match current price structures against the asset's own history or across different coins to see where today's pattern has appeared before. This helps in identifying potential cycle tops and bottoms, understanding the typical duration of consolidation phases, and anticipating the magnitude of the next major move based on historical analogs.
Educational Study of Market Structure
Beyond direct trading or investing, Chart Echo serves as an exceptional educational tool for anyone looking to deepen their understanding of market structure and technical analysis. By repeatedly observing how similar chart patterns resolve across different assets and timeframes, users can internalize the probabilistic nature of the markets. The platform allows you to study the nuances of fractal geometry, understand the importance of context (e.g., a pattern at a market top vs. a market bottom), and develop a more sophisticated, evidence-based approach to reading charts. It is a practical, hands-on way to learn from the market's own history.
Frequently Asked Questions
How does Chart Echo find historical matches for my chart?
Chart Echo analyzes the geometric shape of your current chart, defined by the timeframe and number of candles you select. It then searches its database of nearly 450 million historical windows across stocks and crypto to find patterns with a similar structure. The matching algorithm focuses on the relative shape and sequence of price movements, not the absolute price levels. Each match is ranked by a similarity score, and you can see a detailed explanation of why a particular historical pattern is considered a close echo of your current setup.
Is Chart Echo a prediction tool or financial advice?
No, Chart Echo is explicitly neither a prediction tool nor a source of financial advice. Its core purpose is to provide historical precedent and data. It shows you how similar chart patterns have played out in the past, including the range of outcomes, average moves, and typical drawdowns. This information is intended to inform your own analysis and decision-making process, not to replace it. The platform emphasizes that past performance is not indicative of future results, and all trading and investment decisions carry risk.
Can I use Chart Echo without creating an account?
Yes, you can use the core functionality of Chart Echo for free without any signup or account creation. You can search for a stock or crypto ticker, run a pattern match, and view the historical echoes and their outcome statistics. Creating a free account unlocks the ability to save your workspaces for later review. Premium features, such as Pro Mode, intraday timeframes, saved-setup reminders, alerts, and watermark-free exports, require a paid subscription.
What assets and timeframes are supported by Chart Echo?
Chart Echo supports a wide range of stocks and cryptocurrencies. The platform searches across roughly 450 million historical windows, covering a substantial amount of market data. The specific supported tickers and timeframes are detailed within the app. The "Frame" step in the guided flow allows you to select the timeframe and the number of candles that define your pattern, giving you flexibility to analyze everything from short-term intraday setups to long-term weekly or monthly structures.
Pricing of Chart Echo
Chart Echo offers a tiered pricing structure to accommodate different levels of use. The service is free to start with no account required, allowing you to perform pattern searches and view basic results. Creating a free account enables you to save your workspaces for later reference. For users who require more advanced capabilities, a Premium subscription is available. Premium features include Pro Mode for deeper analysis, access to intraday timeframes for shorter-term trading, saved-setup reminders, proactive alerts when your favorite charts print strong fractals, and the ability to export images and GIFs without watermarks. Specific pricing for the Premium tier is available on the Chart Echo pricing page within the application.
Similar to Chart Echo
Trading Risk Lab
Trading Risk Lab empowers traders to master risk management, optimize positions, and plan trades with precision and confidence.
Tradepal
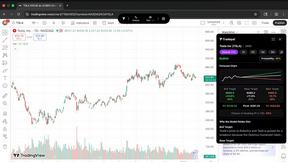
Unlock powerful AI-driven stock analysis with Tradepal, transforming charts into actionable insights and forecasts.
Indexify
Indexify elevates your crypto journey by enabling seamless portfolio management through expert-driven strategies and.
PipBack
PipBack delivers premium discounts and cashback on prop firm challenges and trading tools.