ProcessSpy
ProcessSpy is the definitive macOS process monitor, offering advanced real-time insights with a refined, native Mac experience.
Visit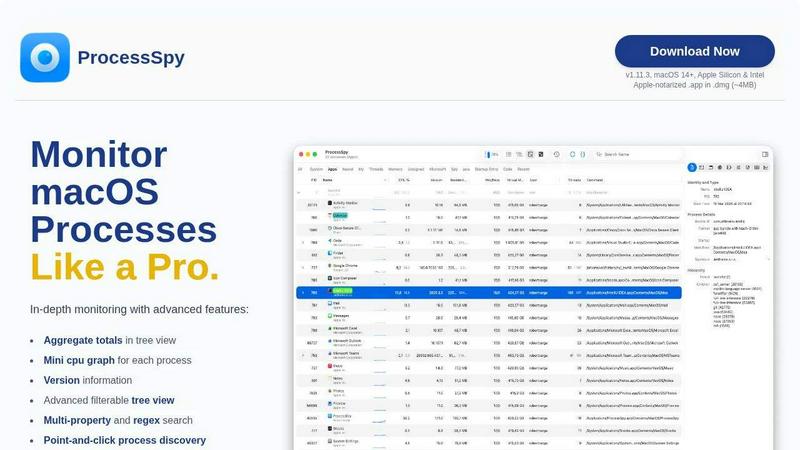
About ProcessSpy
ProcessSpy is the definitive native process explorer and advanced system monitor for macOS, engineered for professionals who demand clarity and control beyond the surface-level view provided by standard utilities. It serves as the sophisticated macOS counterpart to the renowned Sysinternals Process Explorer for Windows, meticulously designed to reveal the intricate inner workings of your system. This tool is indispensable for developers, system administrators, security researchers, and power users who need to diagnose performance bottlenecks, debug complex application interactions, manage resources, or simply understand what is truly happening under the hood of their Mac. Its core value proposition lies in transforming opaque system activity into transparent, actionable intelligence. ProcessSpy delivers an unparalleled depth of insight—from visualizing hierarchical process trees and inspecting open files to viewing environment variables and instantly terminating unresponsive applications—all within a fast, native interface that embodies the macOS ethos of elegance and efficiency.
Features of ProcessSpy
Advanced Hierarchical Process Tree
ProcessSpy presents a dynamic, filterable tree view of all running processes, illustrating parent-child relationships with crystal clarity. Beyond simple visualization, it calculates and displays aggregate totals for CPU usage, memory consumption, and thread counts for entire process groups, enabling you to instantly identify resource-hungry application families. This hierarchical insight is crucial for understanding how applications spawn sub-processes and where system resources are being collectively allocated.
Sophisticated JavaScript Filtering
Move beyond basic search with ProcessSpy's powerful JavaScript-based filtering engine. This feature allows you to construct complex, multi-condition filters using custom JavaScript logic, providing granular control over which processes are displayed. You can filter based on any combination of properties, such as CPU threshold, memory footprint, process name patterns, or start time, creating a tailored monitoring view that surfaces only the most relevant system activity.
Comprehensive Process Context & Inspection
Gain immediate access to a wealth of detailed information for any selected process directly within the main interface. ProcessSpy surfaces full command-line arguments, exact binary paths, and version information—details often hidden by Activity Monitor. With a paid license, this deep inspection extends to viewing environment variables, code signatures, entitlements, Info.plist contents, bundle identifiers, and launch agency, offering a complete forensic profile.
Historical Recording & Process Memory
Unlock persistent system oversight with the paid feature set, which includes the ability to record historical metrics for CPU, memory, and thread usage over time, with data exportable to CSV for further analysis. Furthermore, ProcessSpy can remember finished processes, retaining their command-line arguments, environment variables, and historical data for later review, effectively creating an audit trail of all system activity long after processes have terminated.
Use Cases of ProcessSpy
Developer Debugging & Environment Management
Developers working with multiple runtime versions (e.g., Java, Python, Node.js) can use ProcessSpy to definitively distinguish between identical process names. By displaying the full path, command-line arguments, and version, it resolves confusion, allowing developers to verify which specific JDK instance a service is using or which Python interpreter a script launched, streamlining environment troubleshooting and management.
System Performance Diagnosis & Optimization
When a Mac experiences slowdowns or high fan activity, ProcessSpy is the diagnostic tool of choice. Its tree view with aggregate totals quickly identifies not just a single problematic process, but the entire application tree responsible for resource consumption. The mini CPU graphs per process and historical recording features help pinpoint intermittent spikes and track performance trends over time.
Security Analysis & Application Auditing
Security professionals and privacy-conscious users leverage ProcessSpy to audit application behavior. Inspecting open files, network connections, loaded dynamic libraries (Dylibs), and process entitlements helps uncover unexpected activity. The ability to see launch agents, daemons, and the "Launched By" PID provides critical insight into persistence mechanisms and process lineage.
Managing Stubborn & Unresponsive Applications
Beyond simple Force Quit, ProcessSpy provides authoritative control over misbehaving software. Users can instantly locate and terminate a process, or if necessary, kill an entire problematic process tree to ensure all related sub-processes are cleaned up. This is essential for completely closing applications that leave background components running.
Frequently Asked Questions
Is ProcessSpy safe to install on my Mac?
Absolutely. ProcessSpy is meticulously crafted for security and compliance. It is Apple-notarized and distributed as a cryptographically signed application bundle within a disk image (.dmg). This ensures it has been verified by Apple and is safe to run on both Intel and Apple Silicon Macs, providing peace of mind alongside its powerful capabilities.
What versions of macOS are supported?
ProcessSpy is designed for modern macOS systems, requiring macOS 14 (Sonoma) or newer. It is optimized to leverage the latest native APIs and frameworks, ensuring peak performance and compatibility with current and future macOS features and architectures.
What is the licensing model for the paid features?
The premium license is a one-time purchase of $24.99, granting lifetime access to all advanced features and including free updates indefinitely. A single license is valid for one user across an unlimited number of personal devices, offering exceptional value for professional use.
How does ProcessSpy compare to the built-in Activity Monitor?
Activity Monitor provides a basic overview, while ProcessSpy offers profound depth and control. Key differentiators include displaying full command-line paths, version info, hierarchical aggregate values, multi-property regex search, JavaScript filters, and (with a license) advanced forensic data, environment variables, historical recording, and memory of finished processes—capabilities entirely absent from the native tool.
Similar to ProcessSpy



Egmatic
No-code 2D game editor: visual node logic, drag-and-drop scenes, live preview. Exports to Windows, macOS, Linux, Android, iOS, Web.


laya.tools
A free directory of 950+ projects built on Laya, the open-source decision model. Updated daily.

Forms Plugin
The #1 Native Form Builder Plugin for Framer - No Code, No Embeds, No External Platforms.
JsonTranslate
Translate JSON, Markdown, and TXT files while preserving keys, nested paths, and project structure.