StatPecker
StatPecker transforms your private data into swift, publishable insights and visuals.
VisitPublished on:
August 20, 2025
Category:
About StatPecker
StatPecker is an intelligent data visualization platform that transforms the intricate language of raw data into compelling, eloquent narratives. It is designed for the discerning professional who understands that in an age of information overload, clarity and visual impact are paramount. By leveraging advanced AI, StatPecker automates the entire process of data storytelling, from initial query to publication-ready infographic, in a matter of seconds. It serves a diverse audience, including content creators seeking to enrich their articles, analysts tasked with deciphering complex datasets, marketers aiming to elevate reports, and educators dedicated to simplifying intricate concepts. The core value proposition lies in its unparalleled ability to democratize sophisticated data analysis, eliminating the steep learning curve and significant time investment traditionally associated with tools like spreadsheets or professional design software. StatPecker empowers users to focus not on the mechanics of chart creation, but on the insightful narratives that drive engagement, inform decisions, and foster deeper understanding. With features like its on-device Local SQL Agent, it also prioritizes data privacy, offering a secure and seamless experience for extracting private insights.
Features of StatPecker
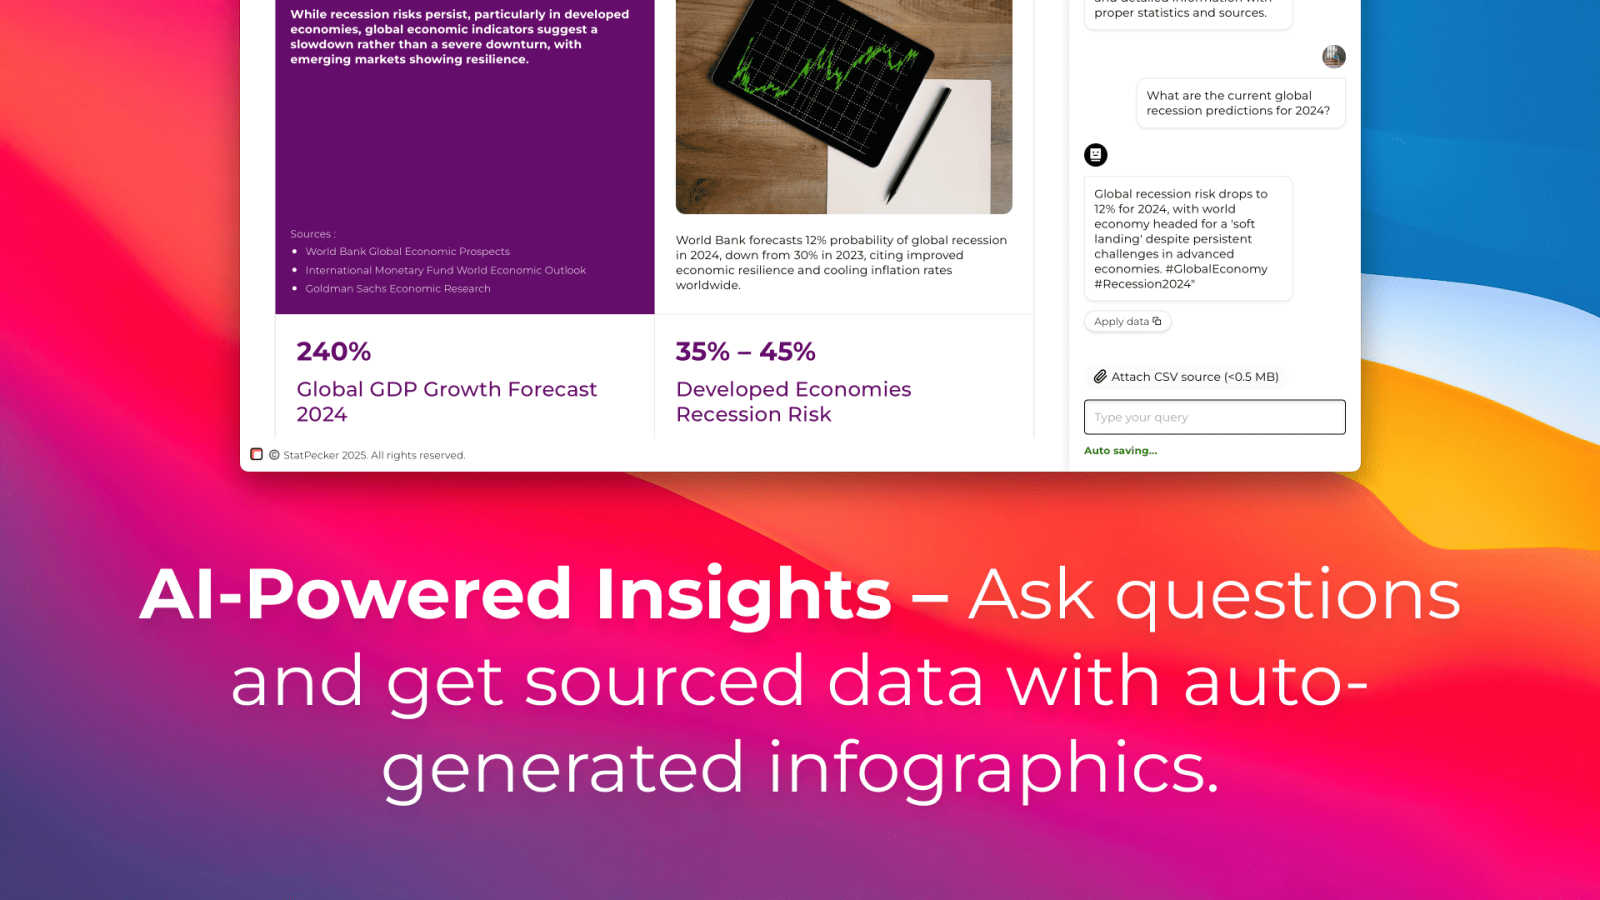
AI-Powered Query Engine
Simply ask your data question in plain language. StatPecker's intelligent engine interprets your query, draws from validated data sources, and generates accurate, insightful answers. This eliminates the need for complex query languages or manual data manipulation, making advanced analytics accessible to anyone, regardless of technical expertise.
Local SQL Agent for Private Data
Analyze your sensitive business data with complete confidence. The Local SQL Agent allows you to upload CSV files directly to your device, where all processing occurs. Your data never leaves your computer, ensuring utmost privacy while you explore trends, summarize metrics, and extract key insights without security concerns.
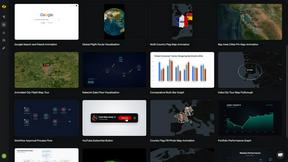
Instant, Publication-Ready Visuals
Every insight is automatically rendered into a clean, professional, and stunning visual. StatPecker produces charts and infographics that are immediately suitable for embedding in blogs, websites, reports, or presentations, saving hours of design work and ensuring a consistent, polished aesthetic across all your materials.
Seamless Embedding and Export
Integrate your interactive visuals directly into your digital content with easy embed codes, or download them as high-quality image files for offline use. This flexibility ensures that your data stories can be shared and presented anywhere, from live dashboards on your company intranet to static slides in a crucial client presentation.
Use Cases of StatPecker
Content Creation and Blogging
Journalists, bloggers, and digital marketers use StatPecker to rapidly create authoritative, data-backed visuals that enhance articles and reports. By transforming statistical findings into engaging infographics, they boost reader engagement, credibility, and shareability without needing a dedicated design resource.
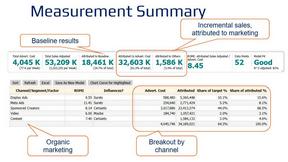
Business Intelligence and Reporting
Analysts and managers leverage the platform to quickly visualize sales trends, operational metrics, and market research. StatPecker turns weekly or monthly data dumps into clear, actionable charts for stakeholder meetings and executive summaries, accelerating the decision-making cycle.
Educational Material Development
Educators and trainers employ StatPecker to distill complex subjects into simple, visually appealing diagrams and charts. This makes abstract data or historical trends more tangible and understandable for students, improving knowledge retention and making learning materials more dynamic.
Secure Internal Data Analysis
Teams handling confidential information, such as HR analytics or proprietary financial data, utilize the Local SQL Agent. They can perform deep dives into their private CSV files on their local machines, generating insights and visuals for internal strategy sessions without ever exposing sensitive data to the cloud.
Frequently Asked Questions
How does StatPecker ensure the credibility of its data insights?
StatPecker draws insights from a curated set of validated and reputable public data sources for its AI queries. For private data analysis via the Local SQL Agent, the credibility stems directly from your uploaded CSV file; the tool acts as an intelligent interpreter of your own verified data, ensuring the output is a true reflection of your input.
Is my data safe with the Local SQL Agent feature?
Absolutely. The Local SQL Agent is designed with privacy as its core principle. When you upload a CSV, all processing, query generation, and analysis occur entirely on your local device. Your data is never transmitted to StatPecker's servers, giving you complete control and security over sensitive business information.
What formats can I use to share the visuals created?
Visuals generated by StatPecker are highly versatile. You can seamlessly embed them as interactive charts into websites and blogs using an HTML snippet. Alternatively, you can download the infographics as high-resolution PNG or JPEG image files for use in printed reports, slide presentations, or social media.
What is included in the Lifetime Access plan?
The Lifetime Access plan is a one-time payment that grants permanent access to all current and future premium features of StatPecker. This includes unlimited AI queries, unlimited CSV uploads for the Local SQL Agent, unlimited projects and embeds, and priority consideration for new feature requests, offering exceptional long-term value.
Pricing of StatPecker
StatPecker offers a straightforward and transparent pricing model designed to provide immediate value. The Free Tier allows users to explore the platform's core capabilities at no cost, including unlimited projects, manual embeds, 25 AI queries, and 10 CSV uploads. For professionals seeking comprehensive, unrestricted access, the Lifetime Access plan is available for a single payment. This plan includes unlimited AI queries, unlimited CSV uploads, unlimited projects and embeds, and priority feature requests, representing a significant long-term investment in streamlined data storytelling.
Explore more in this category:
Similar to StatPecker
InContekst
Decision support framework for high consideration businesses with mix of online and offline channels, content-rich sites, and long customer journeys.
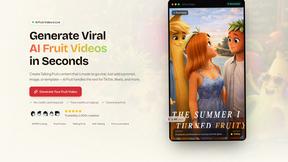
AI Fruit
Generate viral AI fruit videos in seconds — talking fruit, ASMR cuts, and surreal hybrids.

Easymotion - AI Motion Graphic Generator
AI motion graphics and map animation generator for content creators, editors, founders and marketers.

Reelry
Reelry transforms your website into a daily stream of faceless TikToks by learning your brand and generating on-style reels without any filming or.
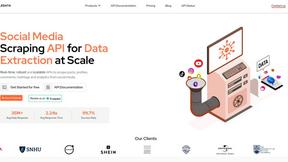
EnsembleData
EnsembleData provides real-time, scalable APIs for extracting social media data to power business analytics and research.
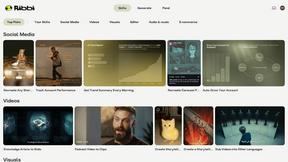
Ribbi
Ribbi is a self-evolving AI agent that automates your entire social media content creation and growth strategy.